Instagram Insights Explained can take the guesswork out of your Instagram marketing. Plenty of bloggers and small business owners post all the time, then look at the stats and feel stuck.
Here’s the good part: Instagram Insights is a free analytics tool built into the app. It shows what’s working, what’s falling flat, and who’s engaging with your content, without extra tools or messy reports.
In this guide, Instagram Insights Explained breaks it down in plain English. You’ll learn where to find Insights, which metrics matter most, and how to do a few quick weekly check-ins so you can grow on Instagram with more confidence and less guessing.
Estimated reading time: 9 minutes

Table of Contents
Key Takeaways
- Instagram Insights helps you track what works in your marketing strategy without complicated tools.
- To access Instagram Insights, switch to a Professional Account and find the dashboard in your profile.
- Focus on key metrics like Accounts Reached, Engagement, and demographic data to tailor your content effectively.
- Use insights to plan posts, publish at optimal times, and track clicks that drive business growth.
- Regularly apply Instagram insights to make data-driven decisions for content and audience engagement.
How To Access Instagram Insights and Set Your Account Up Right
Before you can read any data, you need the correct account type and to know where Insights lives.
Switch to a Professional Account to Access Instagram Insights
Instagram only shows Insights to professional accounts. That means Business Account or Creator, not Personal accounts.
In simple terms:
- Personal: for private use, no Insights.
- Creator: for influencers, bloggers, and content creators.
- Business Account: for brands, shops, and service providers.
Most bloggers and small businesses can choose either Creator or Business Account. You can change it later, and it does not cost money.
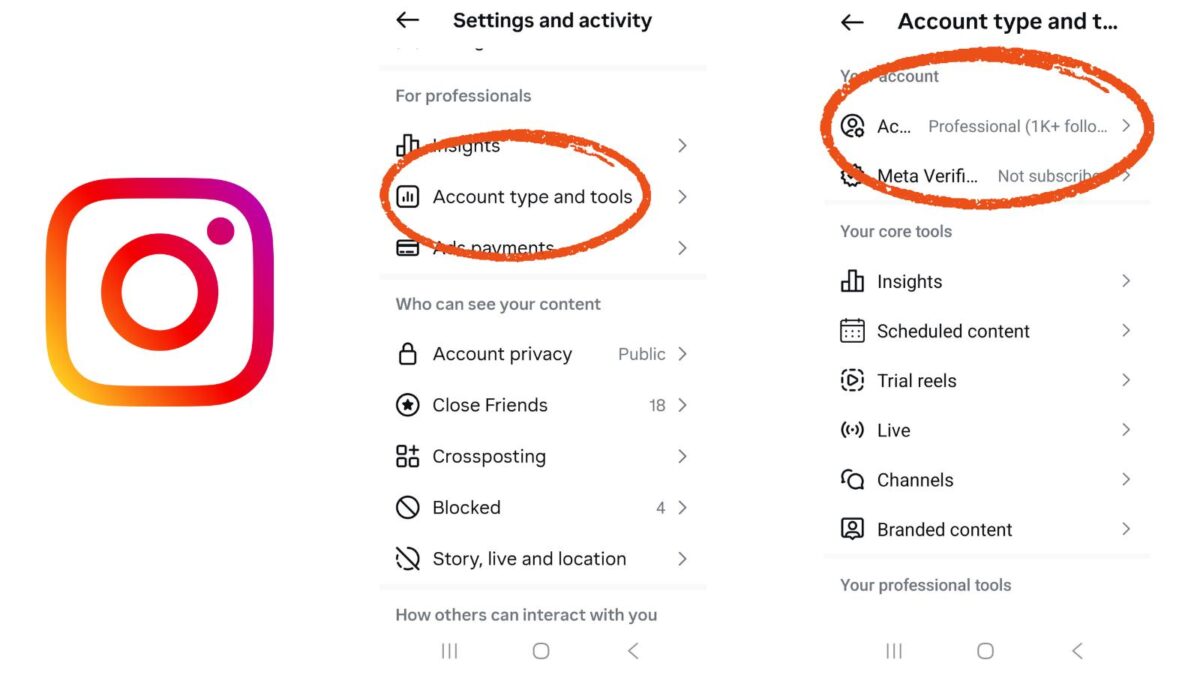
To switch on the Instagram app:
- Go to your profile.
- Tap the three lines in the top right.
- Tap Settings and privacy.
- Scroll to Account type and tools.
- Tap Switch to professional account.
- Pick Business Account or Creator, then follow the prompts.
If you want a reference straight from Instagram, their Help Center explains the professional dashboard setup in more detail.
Once you switch, you will see a “View professional dashboard” button on your profile. That is your shortcut to Profile Activity within Instagram Insights.
Where to find Instagram Insights on your profile
You can open Insights in two simple ways:
- From your profile, tap View professional dashboard at the top.
- Or tap the three lines, then select Insights from the menu under settings and activity.

Some stats only appear after you post a few times and have at least a small audience. If the numbers look thin at first, keep posting for a couple of weeks, then check again.
Instagram Insights Explained: The Metrics That Actually Matter
Instagram Insights gives you lots of numbers, but only a handful really guide wise choices.
Think of Instagram Insights like a field guide. You do not need every detail, just the signs that tell you what to post, when to post, and what drives clicks and sales.
For a deeper technical breakdown, you can compare your numbers with resources like Sprout Social’s guide to essential Instagram metrics, but let’s keep things simple here.
Overview tab: reach, engagement, and follower growth at a glance
When you open Insights, the Overview tab is your “health check” screen.

Key metrics:
- Accounts Reached / Viewers: how many unique accounts saw your content?
- Accounts Engaged: how many accounts liked, commented, shared, saved, or replied.
- Total Followers: how your follower count changed in the time period you picked.
How to use it:
- If Accounts Reached is up, but Accounts Engaged is flat, more people are seeing your posts but not interacting, and your engagement rate may be dropping. Try a stronger hook in the first line or ask a straightforward question in your caption.
- If Accounts Engaged is up but Total Followers are flat, your current audience loves you, but new people are not following. Add more Reels or shareable posts that reach non-followers.
- If Total Followers jump on a particular day, tap into the content from that day. Instagram now shows post-level follower growth, so you can see which Reel or post brought in new followers.
Check this tab once a week. You only need to ask, “Am I moving in the right direction?”
Audience tab: who your followers are and when they are active
The Audience tab shows audience demographics, like who follows you and when they are online.

You will see:
- Age range.
- Gender split.
- Top locations.
- Most active times by days and hours.
Key audience demographics help you match your content to your real audience, not the one in your head. Content creators can use this data to tailor topics and visuals effectively.
For example, if your top location is “London” and your active hours are 7 to 9 p.m. local time there, but you live in New York, your best posting window may be early afternoon your time.
You can also adjust topics and visuals. If most followers are 25–34 and based in cities, you might show more fast tips, time-saving tools, or city-style photos rather than family-focused content.
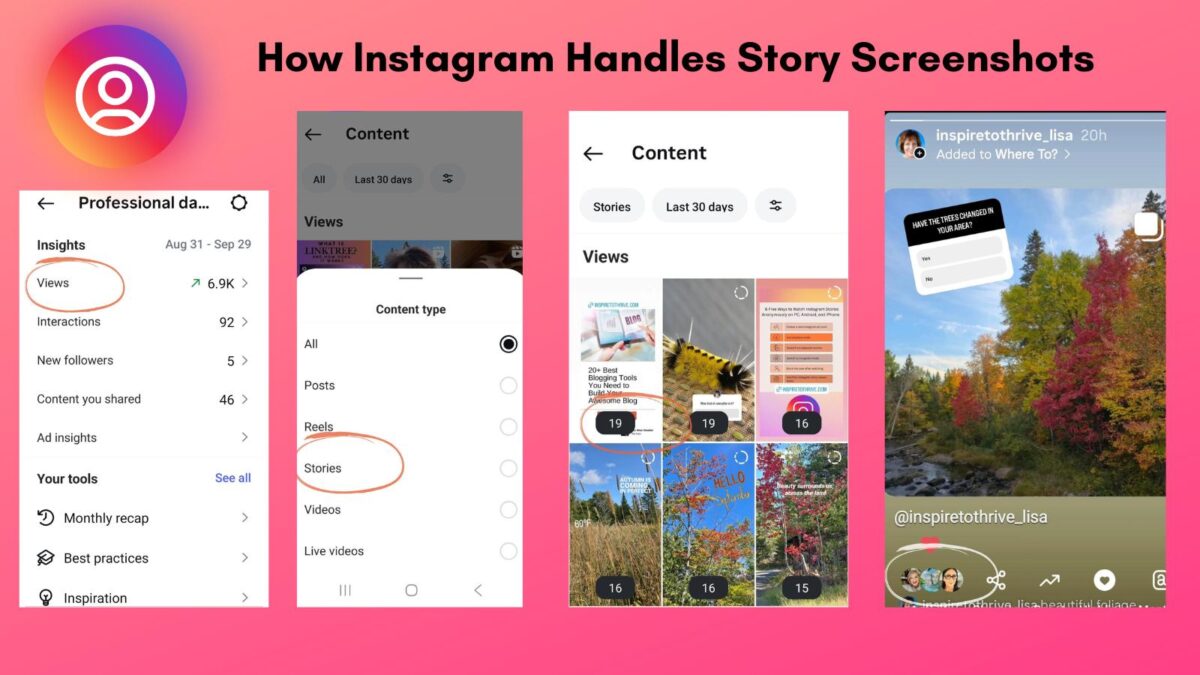
Content Performance: Saves, shares, and video views that drive results
At the post or Reel level, Insights shows the post’s performance and each piece’s performance.
Common metrics:
- Impressions: total times your post was seen, reflecting overall visibility.
- Likes, Comments, Saves: visible engagement options.
- Saves: how many people saved your post for later, a key content interaction.
- Shares: how often people sent or shared your post, another vital content interaction.
- Profile Activity and website taps: how many people moved from content to your profile or website?
- Video views, Stories Insights, and completion rate for Stories; Reels Interactions and completion rate for Reels.
For a blog or business, saves, shares, and link taps usually matter more than Likes, Comments, and Saves. They show genuine interest and buying intent. Impressions provide the baseline for total visibility.
Instagram now also reveals which part of a Reel or which image in a carousel hooked people, including Stories Insights and Reels Interactions. Use that to repeat strong hooks, angles, or designs.
Once a month, sort your posts and Reels by saves, shares, or website taps to review their performance. Look at your top 3 from the last 30 days and ask, “What do these have in common?” Topic, format, hook, or style, that pattern is your content roadmap.
How To Make the Most of Your Instagram Insights To Grow Faster
Now that you have Instagram Insights explained, the goal is simple: turn data into small weekly habits that inform your marketing strategy.
Use Insights to plan what to post next week
Set a 15-minute date with your Instagram analytics every week.
Try this routine:
- Open Insights and set the date range to the last 7 or 14 days.
- Tap the Content you shared and sort the posts’ performance by reach or engagement.
- Note your Top Performing Content: top 3 posts or Reels in a notebook or simple spreadsheet.
- Write what they share: topic, format (Reel, carousel, Story), hook, or visual style.
- Plan at least 2 posts for next week that copy those winning patterns to refine your marketing strategy.
If you want more examples of this process, Social Media Examiner has a helpful walkthrough on using Instagram Insights to shape a content plan.

Post at the best times for your followers, not for you
Use the Most active times section in the Audience tab to optimize for the algorithm.
Pick 2 or 3 main posting windows based on when your followers are online. For example, “weekday evenings” and “Saturday mornings.”
Then:
- Post everyday content in those windows.
- Test essential posts, like launches, new blog post promos, or Live Videos, in different high-activity slots.
- After a few weeks, check which time blocks give you higher reach and engagement and lean into those. Timely posts like this boost your total followers and drive faster growth.
If you want a deeper dive into timing strategies, tools like Iconosquare break down the best time to post on Instagram with examples and graphs.
Track what leads to clicks, sign-ups, and sales
Likes, Comments, and Saves feel good, but business growth comes from Content Interactions that drive clicks and actions.
Watch these metrics closely:
- Profile visits.
- Website taps.
- Link Clicks, including those from Stories Insights and Reels Interactions.
Add clear calls to action in your captions and Stories. For example:
- “Tap the link in bio to download the checklist.”
- “Send me a DM with the word ‘RATE’ for pricing.”
- “Save this post so you can follow these steps later.”

After a promo, open Insights and check which posts or Stories drove the most profile visits, website taps, and Link Clicks. Jot those numbers down once a week in a simple tracking sheet.
Over time, you will see what actually moves people from Instagram to your site, email list, or shop.
Conclusion: Instagram Insights Explained Easily
Instagram Insights can look scary at first, but at its core, Instagram Insights explained is just this: use simple numbers to make smarter choices. You do not need to be a data expert; you need a curious eye and a weekly habit.
Remember the basics: open Instagram Insights, understand reach and engagement, and use the Audience tab, including Audience Demographics. Check them once a week.
Use what you see to decide what to post, when to post, and which content, like Live Videos, drives clicks, sign-ups, and sales for your blog or Business Account while growing your total Followers.
Before you move on to your next task, open your own Instagram Insights. Choose one small change to test this week based on what you see and let the data guide your next smart move.


- 5 Hashtags Per Post on Instagram: What Changes Now - March 31, 2026
- Why Hiring a Business Consultant for Bloggers Can Grow Your Blog Business - March 30, 2026
- X Influencers: How to Find and Connect with Key Players in Your Niche (Formerly Twitter) - March 29, 2026