When you create an ad campaign on Facebook, your job does not stop there. You need to track and analyze your Facebook ads performance to figure out what is working and what is not.
A great way to do this is by creating a Facebook ads dashboard in Google data studio. This allows you to see all of your Facebook (now called Meta) ads performance data in one place, quickly seeing how well your campaigns are doing.
Table of Contents
Google Data Studio for Facebook Ads Performance
Google data studio is a data visualization tool that allows you to easily create customized dashboards using your data. It’s beneficial for reporting because it gives you the ability to quickly customize your dashboard design.
Then, you can share it with anyone without any need for them to log into another tool.
You can use Google data studio to build reports for all kinds of marketing channels, including social media ads. Facebook ads are a powerful tool for your marketing strategy, but it’s essential to keep track of how well it performs once you’ve made the ad.
This article will show you how to create a Facebook ads performance report in Google data studio (preferably on your Google desktop) Not only that, but how to analyze Facebook ad performance.
Before you get started, make sure your Google Analytics account is connected to your Facebook Ads account. Eagyltics has a free Facebook ads connector for Google data studio. For that purpose, a Facebook ads account is necessary.
You can use your personal Facebook account to log in or create a business account if you haven’t already. If you’re new to setting up ads, you might want to check out the Ads Manager Quickstart guide.
Step 1: Start by Creation of Facebook app
To connect your Facebook ads data to an external site like Google Analytics, you will first need to create a Facebook App.
This will give you the required access token to connect to Google Analytics.
Step 2: Create a copy of the Facebook Template Report
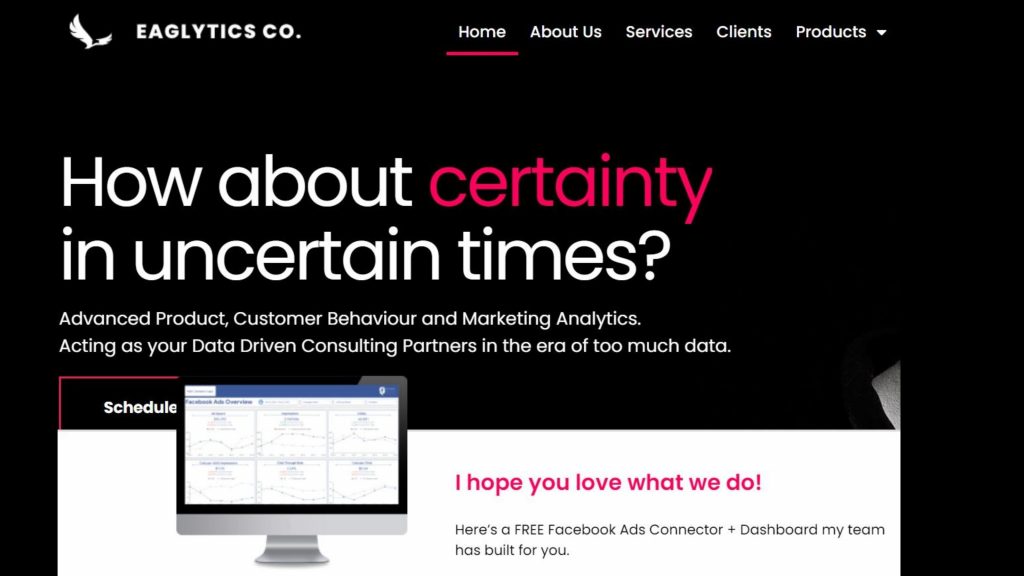
Once your Facebook app is connected, you then create a copy of the Facebook ads dashboard from Eagyltics. It is FREE to set this up.

Set up your Facebook ads performance dashboard.
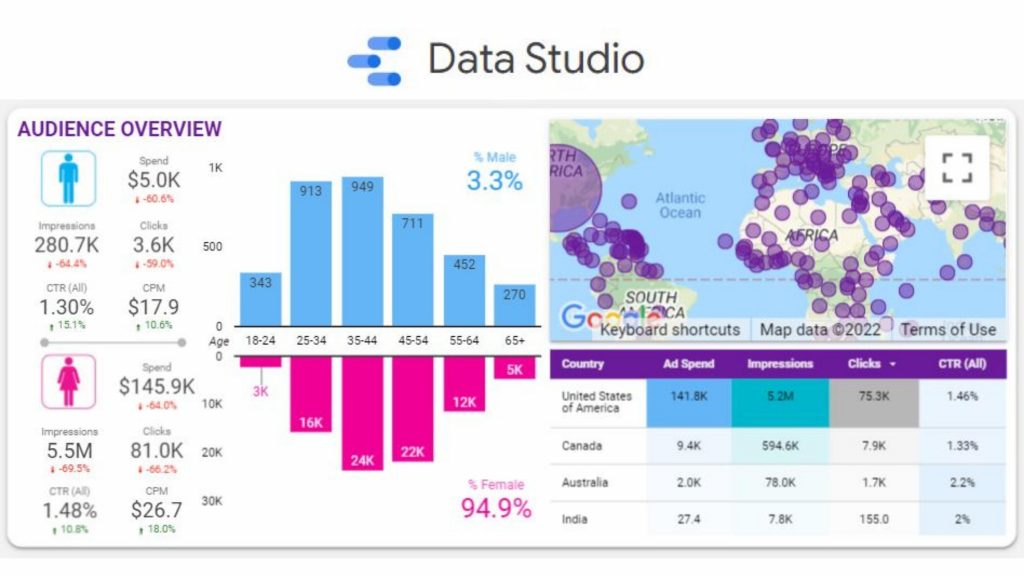
If you aren’t sure what kind of data you should be looking at or how to best view that data, you can build a Facebook Ads Performance Report in Google Data Studio. The Facebook dashboard from Eagyltics is a great template to get started with.
It includes all the most relevant metrics you should be tracking. You can see impressions, spending, CPC, audience overview, and platform data. If you do not have your own data connected yet, you can preview the Facebook ads dashboard.
Then, take a look at all the reports, customizations, and filters available to you to help manage your Facebook ads.
Customize Your Dashboard Design and Share Your Facebook Ads Performance Report
The great thing about Facebook ads is that the targeting options are endless. You can target just about any demographic and interest using their self-serve advertising platform. Data Studio helps pull together all the data and information to create a cohesive report that you can then share with yourself or others.
Google data studio comes with access to many free visualizations and valuable datasets. What I like about Google Data Studio is its flexibility. The tool helps you create professional reports and dashboards by providing great templates.
You can also use pre-built reports to publish immediately. If it is not accurate, you can edit and customize it to your needs.
It’s easy to learn so anyone can create a great dashboard in less than an hour. You can easily configure the report for your needs. The template version of Google Data Studio makes it very easy to create various kinds of reports.
For instance, in a report about Facebook ads performance, you can create a column chart for ad statuses and another one for ad type. Simple data tables are used to show the numbers.
A dashboard can be made with a few simple pie charts and advanced charts such as a column chart and statistics.
You Can Easily Create and Share a Facebook Ads Performance Report Using Google Data Studio
So you’ve set up your Facebook ads dashboard in Data Studio, and now you want to share it with your teammates. Here’s how to do that:
- First, select the share button in the upper-right corner of the report.
- Then, In the Share settings window, add the email addresses of the people you want to share the report with.
- Next, check the box next to edit to let others edit your report, or check Can view to allow them to view only.
- Lastly, you can also copy a link and share it with others.
Google Data Studio
Google Data Studio is a reporting tool that helps you visualize data in a way that’s simple, clean, and easy to understand. Now you can create and design reports yourself with minimal effort. The feature set is designed to save you time so you can focus on the important stuff (i.e., generating results for your clients).
The best part is that you don’t need to understand SQL or be able to connect all the dots within your Facebook Ads account to build an influential report. Click on the elements you want to add and click “Add to Report” at the bottom of the window.
Therefore, if you haven’t already added your Facebook data, do it now! It’s easy to add and share a Facebook Ad performance report with Google Data Studio. The step-by-step guide is for you to start using it.

Once the basics are covered, you can check out the exciting templates that let you analyze your data by demographic and break out all the interest groups you need to target ads for your business.
Conclusion
The creation of reports in Google data studio is mandatory to have with you if you are working as a digital marketer. Even in affiliate marketing, the Facebook ads dashboard plays an important role by always providing real-time information about everything that you need to grow a digital business.
Finally, keep a record and utilize it for future references and to satisfy clients too.
Now, do you feel you have learned how to track Facebook ad performance with Google Data Studio? Do you know how to analyze your Facebook ad performance as well? I’d love to hear from you if you have used it or if you will try it.
- Pinterest Links: How to Fix Wrong URLs on Old and New Pins - January 9, 2026
- What To Do When Someone Steals Your Blogging Ideas - January 8, 2026
- Instagram Story Viewer: Watch IG Stories Anonymously and View Content Safely - January 7, 2026


