Do you want to know what’s working on X today? Twitter X analytics can provide you with a wealth of information about your posts and how they are being engaged by others. By taking the time to read your Twitter analytics, you can learn more about your unique audience and what kind of content is resonating with them.
Here are some key elements to look for in your Twitter analytics if you are a Twitter Blue subscriber: But one new TIP: Use your mobile device as more features are available there today.
Table of Contents
How To Find Your X Twitter Analytics:
I made a video so you can easily find your X Twitter analytics and learn to read your Twitter analytics like a dummy. It’s easy to get started with your X account on desktop or even on your mobile device now with a premium account.
Read Analytics Easier
Twitter analytics is a great way to know more about your own Twitter X posts and what is working or not. You can learn what your audience likes on the Twitter X platform.
These analytics will help you to post better so your audience will stay engaged. You can find yours under the creator studio section of your Twitter X account with a premium subscriber account.
Free accounts on X no longer have access to these analytics.
You need to have Twitter Cards or use Twitter ads to see your analytics. Here is some of what you can see:
- Engagement rate: This metric measures how often people are interacting with your tweets. A high engagement rate means that people are finding your content interesting and valuable.
- Tweet reach: This metric measures how many people saw your tweets. A high reach means that your content is being seen by a lot of people.
- Engagement per tweet: This metric measures how often people are interacting with each of your tweets. A high engagement rate per tweet means that people are finding your content interesting and valuable.
Read the Home Section
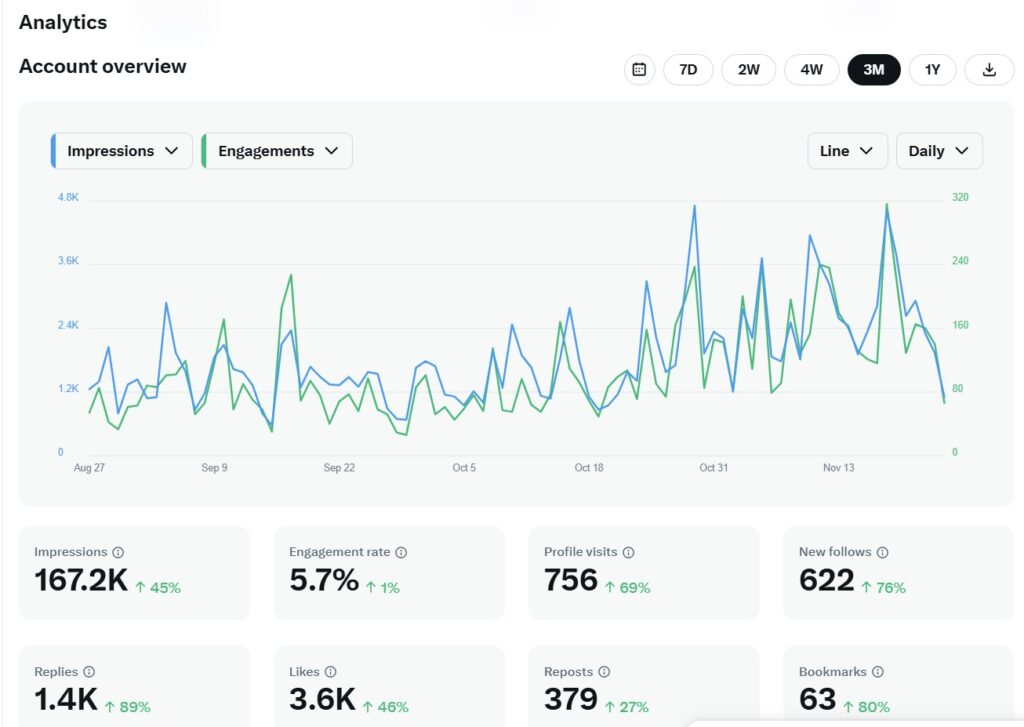
This is where you see how many tweets you have made in the past 28 days. The home area shows you how many impressions your tweets received.
This area also shows you how many followers you have and have gained or lost. (This section is for those with or without a subscription on X) However, many users no longer have access to it without a subscription.
You can also see how many mentions your tweet posts are receiving and how many followers you have. The analytics also show you percentages for each of these categories.
You will also see a green or red arrow. Green is for doing better, red is for doing worse in the past 28 days. Furthermore, you can also view your top tweet, top mention, and top follower.
When you scroll down you can view all of this day by day for the past 28 days.
Your Activity In Analytics
When you read Twitter analytics this area shows your impressions. Impressions are how many times your tweets were seen by others. It also shows your engagement rate which is very important today.
Engagement ranks high on all social networks. Engagement is when others respond to your tweets and when you respond back.
It is what social networks should be all about, talking with others on the network. (Not screaming out your offers or just lurking around others.)
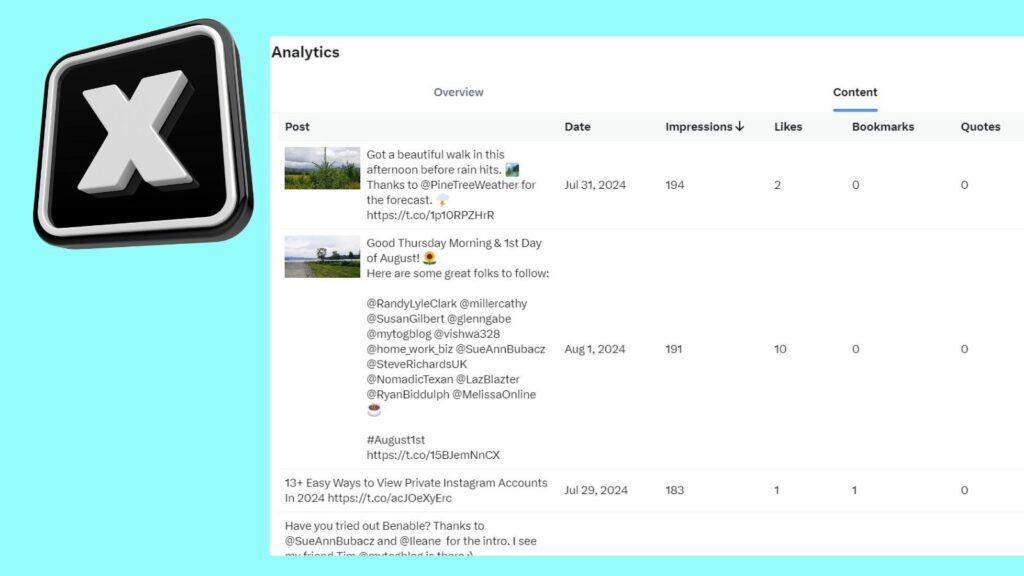
Your Twitter activity will also show your tweets links get clicks, retweets, likes, and replies. Getting clicks is more related to ROI – if when they click they continue to click at your website or blog.
However, be sure what they click is relevant to your tweet. People do not like clicking on links to be led somewhere else.
Not good for them to come back to your X profile.

Dive Deeper Into Reading Your Analytics
You can read Twitter analytics like a dummy if you know where to go with a X Twitter subscription. Next, you can go further and see this information for each tweet you have posted in the past 28 days.
Lastly, you may also view them by choosing different months from a drop-down menu.

Your X Twitter Audience Removed from Analytics
Twitter X has removed this popular feature back in 2020.
However, if you use a business account or Twitter ads you may be able to see this in your Twitter ads account. I was not able to even with a Twitter X subscription and ad account.
You may notice they claim they are still working on this part of Twitter X with all the recent updates and changes on the social media network. Check your mobile device as they are there first before desktop.
So instead, I found a tool that can do it for you called Followers Analysis, it does cost $55 for a report on your Twitter account’s demographics.
And of course, my favorite Twitter tool Fedica also offers a paid service as well for audience demographics.
Conversion Tracking via X Twitter
Twitter allows you to track as well by adding code to your website. In order to do this Twitter guidelines say you must have an updated privacy policy on your website. On Twitter, it states: “Make sure your privacy policy is up to date.
Twitter’s policy requires that your website provide legally sufficient legal notice about how you are using third parties to collect website traffic data.”
Conclusion: Reading Your X Twitter Analytics
Understanding your analytics is the key to smarter decisions for your business. The data isn’t just numbers—it’s a guide to what’s working and what’s not.
Focusing on key metrics like traffic, engagement, or conversions can highlight areas to refine and build on. Don’t get overwhelmed by the full dashboard; stick to the insights that directly connect to your goals.
Regularly reviewing this data helps you catch trends early and adjust your strategy as needed. Your analytics tell a story—make sure you’re using it to write the next chapter for your success.
FAQs: Reading Analytics on X
You see which tweets are working best for your audience. Which get the most engagement and clicks as long as you have a subscription on the X network.
No, you cannot find them on them anymore. You may see more of it on Twitter ads or if you use Fedica.
The top media tweet consists of an image or video. Anything besides just text on a tweet.
Impressions are how many times a tweet is seen in the Twitter feed.
Followers Analysis, and Fedica.
By knowing special holidays and events coming up you can tweet with the hashtag to be seen more in the Twitter feed. It helps you to market better.
- How to Add FAQ Schema in WordPress (Rank Math, Yoast, or Manual) - February 6, 2026
- Porn On Instagram – How To Filter Out Explicit Material On IG - February 6, 2026
- Missinglettr Review: Time Saving Smart Social Media Marketing Automation - February 4, 2026


Lisa, Twitter Analytics is a great way to also clearly understand our audience insight, content performance, follower growth, campaign effectiveness, etc.
Look, To add to your points, here are a few other benefits:
Audience Insights: Understand your followers better, including demographics, interests, and locations, to tailor your content.
Content Performance: Track which tweets and content types are most engaging and adjust your strategy accordingly.
Follower Growth: Monitor your follower count and identify trends that can help you gain and retain followers.
Hi Foster, yes those points are done with tools today as it is not available on Twitter yet as they are updating their analytics. Thanks for your insightful input and have a great day Foster.
Great tutorial Lisa!
I’ll make good use of it:)
The truth is that I only recently discovered Twitter Analytics, and that through another post of yours, so I haven’t dabbled with it quite yet.
But that’s about to change real soon!
Thanks:)
You are most welcome Nikola, Hope you really find some informative stuff there! Enjoy your weekend.
Hi Lisa, awesome article! If I can predict the future popularity trend of a Twitter event, what can you potentially use it for? E.g., say my system can take top 100 currently popular events on Twitter, and tell you which ten of them would surely see a high increase in popularity in the next hour on Twitter.
Hi Lisa, welcome to Inspire to Thrive. Thank you. It really depends on your niche Lisa, if it is relevant you could surely do some re-tweets and engage with those on the network about it. Maybe you could become part of their Twitter events. Thanks for coming by and have a great day!
Hi Lisa,
you are right Twitter analytics are a great way to know more about your audience. in this we can find taste of our customer and we can give them a good quality product then we can earn loyalty from them.
Thanks for sharing this beautiful article with us.
Hi Gaurav, you are welcome. Yes if you know more what your customer likes you can tweet more about that to keep them following and hopefully engaged with you along the way. Thansk for coming by and have a great weekend ahead.
Hi Mi, thank you. I hope it didn’t take too long to load. It’s not always about the Twitter followers they have – it’s more about the engagement that happens with them and others. If they have a lot of followers and are very engaged on the network – that’s the BEST combo. You are welcome Mi and thanks for coming by. Have a wonderful rest of the week.
My head is spinning a bit right now with all this information. This is great, I may need to reread this a few times.
I have not been very active on Twitter but I would like to.
I didn’t realize all this analytics information was available, so I appreciate this post very much.
-Dan
Hi Dan,
Oh no, I didn’t meant for your head to spin. Once you look at them – it is pretty easy. Not as hard as Google Analytics if you use those. Thank you for coming by and have a great day. Let me know if you have any questions once you check out your Twitter Analytics.
Hey Lisa,
Amazing stuff! Twitter is evergreen social media platform and it has potential to maximize your productivity level. You have shown great stats regarding subject with the help of effective infographics. Thanks for sharing.
With best wishes,
Amar kumar
Hi Amar, Some days it can be evergreen and other days I’m not so sure with how fast things move there. It really does help my productivity level when used right. Thanks for coming by and for your input on this one Amar. Have a wonderful Wednesday!
Thank you Brenda. I use Twitter first and mostly Facebook for non-Twitter friends and family. I love the analytics here. It really does provide a wealth of info. You are welcome. And I’m working on this CommentLuv thing! Happy Tuesday GF.
Yeah for Tuesday! It’s going to be 80’s here today! Woohoo! I think I feel a sickness coming on! I do love Twitter. Maybe one of the reasons I have 3 usernames? LOL
Hi Bren, here too. Thanks for testing this out and it appears it is back working. Awesome! I don’t know how you keep up with 3 Twitter accounts. It is not easy!
Hello Lisa,
I have not used Twitter Analytics yet, and it sounds like I am missing out on that. I do use Twitter & FB & Reddit quite a bit. Lately I am on instagram now and trying to see how I can make it a better use for a blogger.
But I think you make it sound like fun and I should get more analytics of my tweets and see how they are doing and how many engagements I am able to catch up.
Hi Praveen, yes – you are missing out! I used Yoast free for years and it provided me the Twitter cards so I could see the Twitter analytics. I highly recommend it. I would love to learn more on Reddit, do you have a post about it? I use Instagram more for fun and to stay on top of that social network. Thanks for coming by Praveen and have a wonderful day. (If you have a Reddit post, point me to it.
Lisa – I think you have just given me an idea for my next blog post.I hope I can do some justice in the same. Keep you updated.
Hi Praveen, Have you been using your Twitter analytics Praveen? Oh yes, do keep me updated on that. Glad I could be of help. Have a great weekend.
Hi Lisa,
Love how engagement keeps getting more important on social media. Especially on Twitter.
I just reached 50,000 followers a few days ago. How did I do it? 1 follower at a time. 1 engagement at a time. Like how you do it. Amazing how easy this Twitter thing gets if you @reply folks for even 10 minutes on a daily basis. They tweet you, thru RT or chat, you tweet back and as friendships form Twitter gets happier and happier. Because social media is about bringing the world together versus trying to out shout one another. Or on Twitter, out shot, because it gets like the Wild West with rapid fire tweeting at times LOL.
Thanks for the helpful post.
Signing off from Thailand.
Ryan
Hi Ryan, how are you today? I agree, engagement is KEY. Number uno. Wow, that’s awesome on your follow count Ryan. I find Twitter a happy place too, I think it is because of who I follow and who are on my Twitter lists. Thanks for coming by on this one and for your input. (I’m noticing your CommentLuv links are not showing up, I think CommentLuv is beginning to have issues.:( )
Hi Lisa,
As you know, I am very new to using social media. I checked my analytics, it wasn’t even turned on. I just turned it on. Thanks for sharing this because I never pay attention to my Twitter analytics.
I’ve been using Twitter for about 3 months and learning as I go along. There’s so much to learn and that’s why I am trying to narrow down to the top 2 social networks. Right now, Pinterest and Facebook are my best performers and I am trying to learn as much as I can about those networks.
I have realized that it’s virtually impossible to focus on all the networks and learn the ins and outs of it.
I know that it’s definitely going to help other people out. It helped me by realizing I didn’t even have analytics turned on.
Have a great day.
Susan
Hi Susan, I’m so glad you were able to turn yours on today. That’s great! Twitter takes time to get some traction but once you do, it will snowball. Facebook is my erd after Twitter and Flipboard. I do like Pinterest but it’s not a big source of traffic for me here. I know it’s great on retail sites and some others. I don’t spend as much time on it like I used to either. Thanks for coming by and have a great day too Susan.